Objective data to solve your mobility questions.
We deliver insights
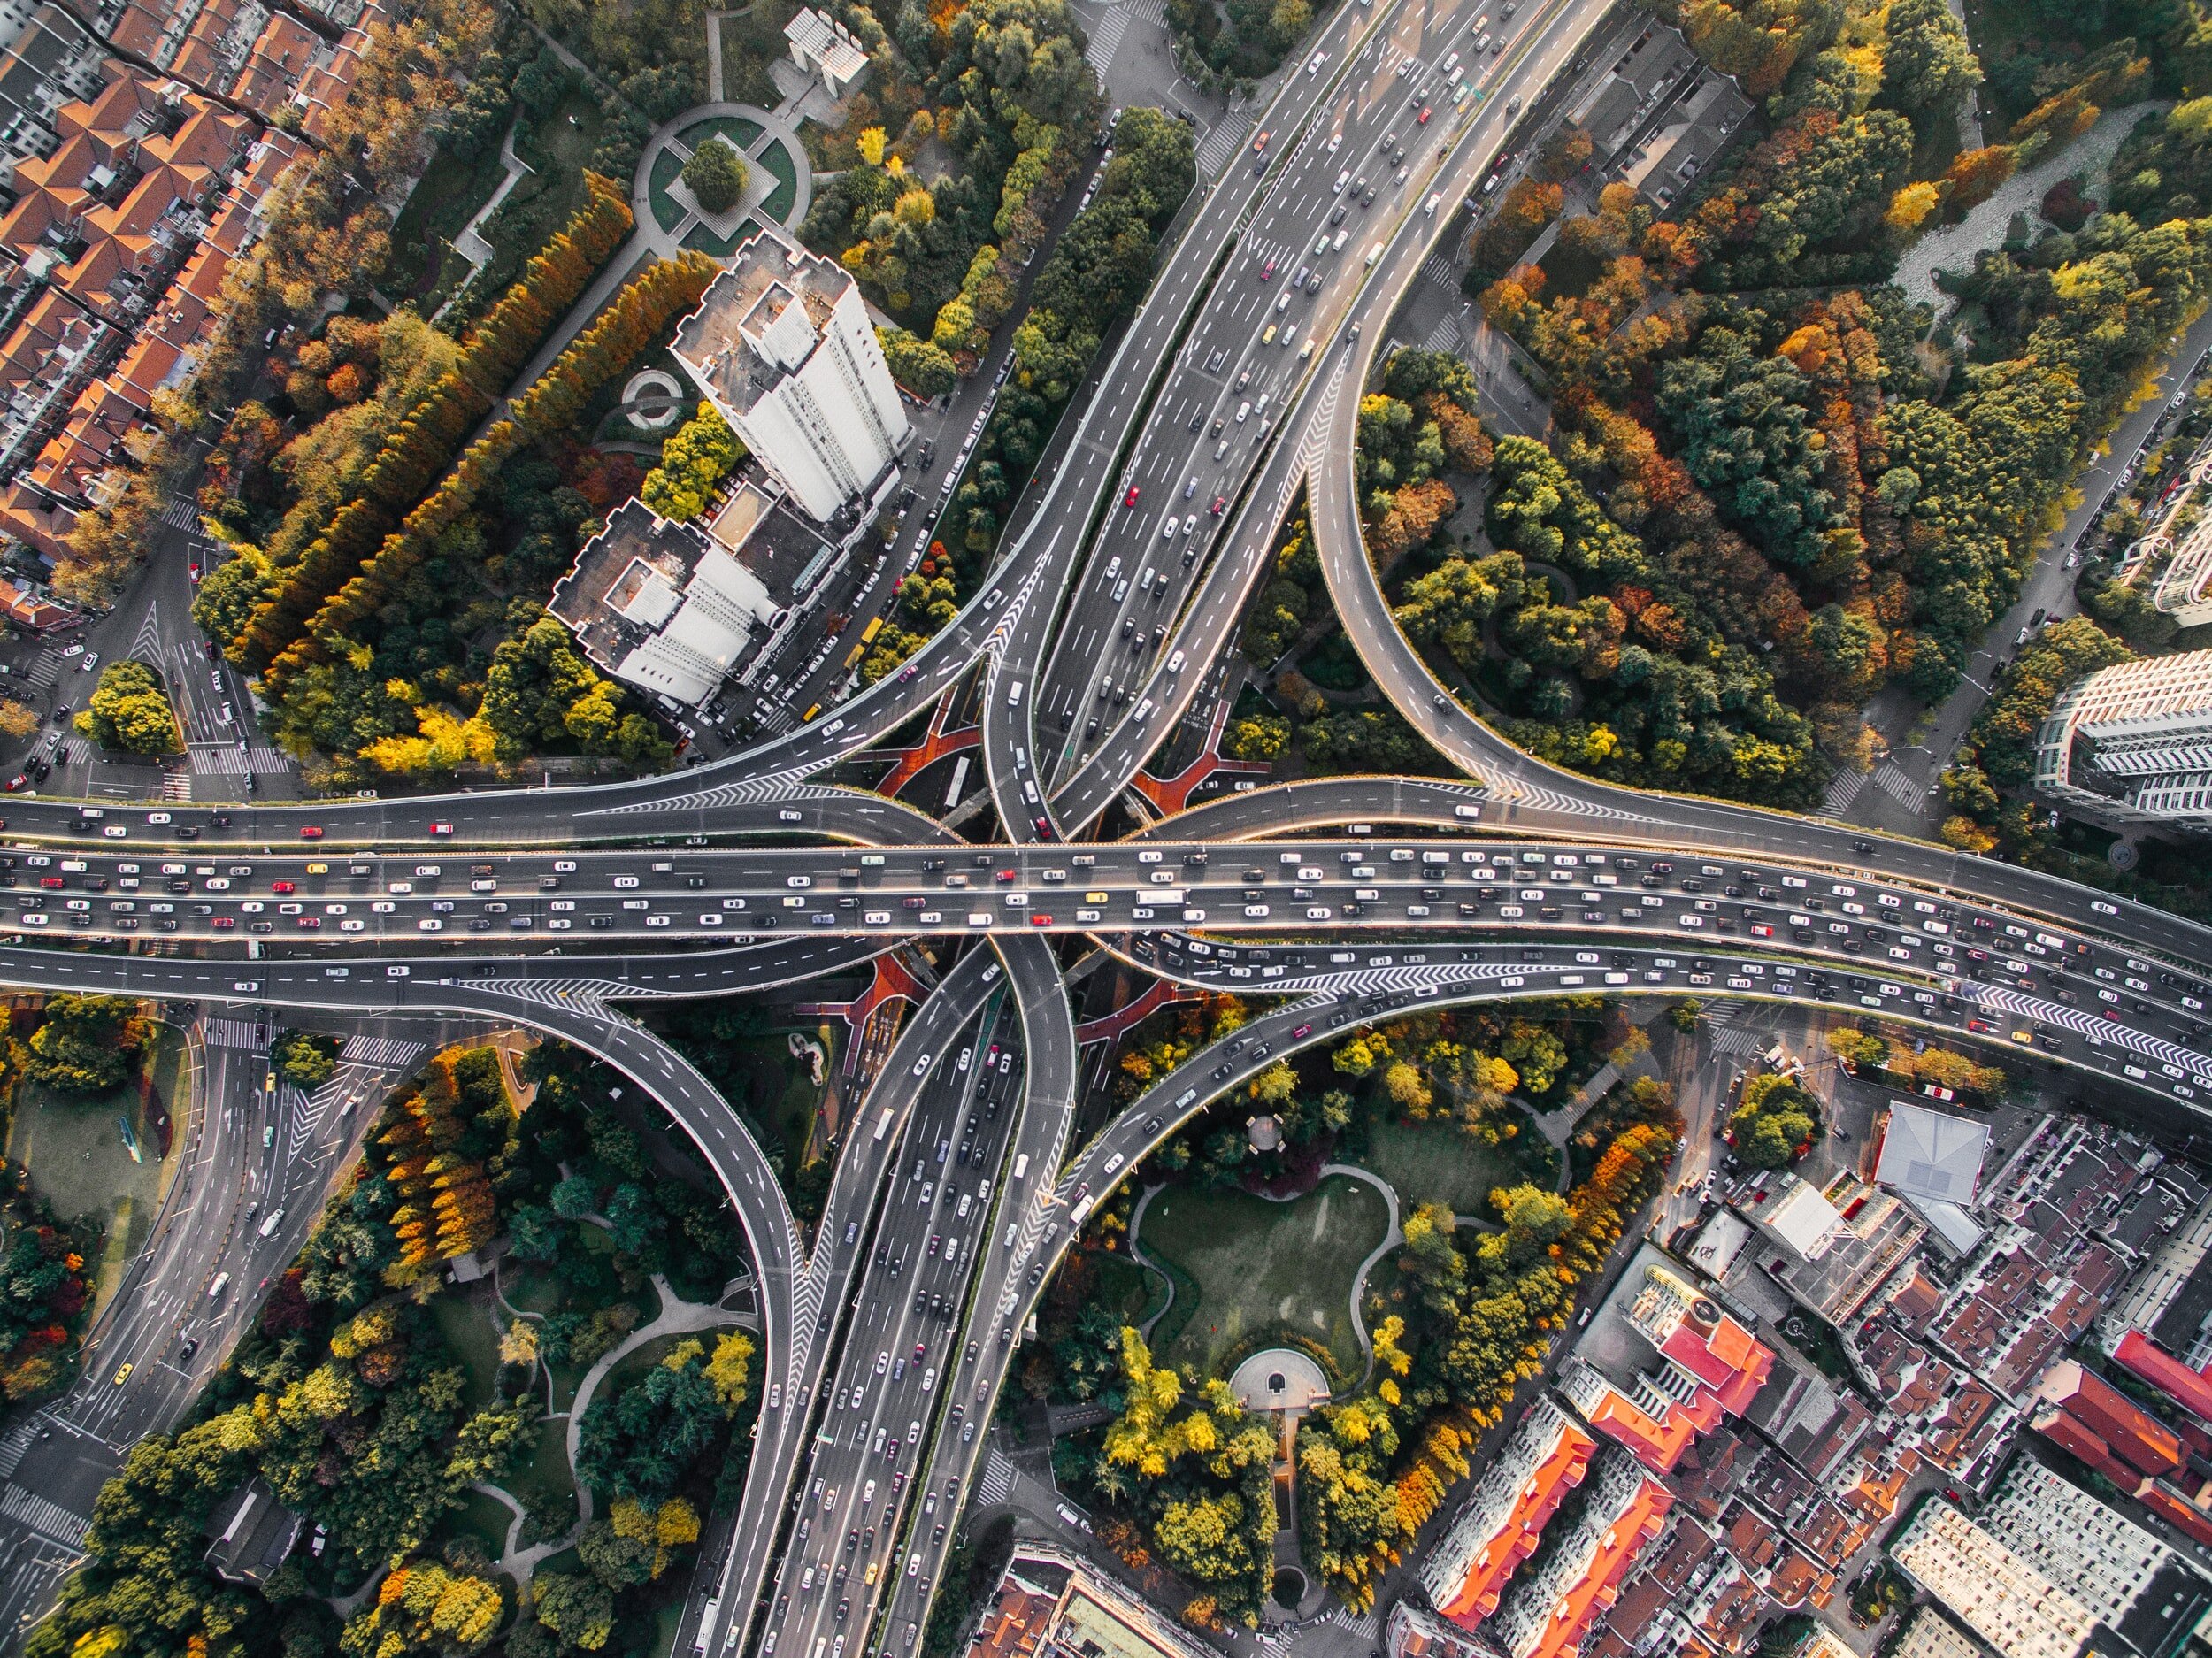
Real time and historic traffic data
We have an abundance of traffic information at our disposal, such as speed (average or in percentiles), travel times, bottlenecks, origin-destination analysis, or hotspots in a certain area.

Absolute numbers
You can count and classify the number of vehicles, including pedestrians and cyclists on the street or on crossings. In an instant, you can see which vehicle came by at what time and from which direction on our intuitive platform.

AI solutions
AI cameras are being used to analyse crossings in detail. Which movements cause the majority of near-misses, and which types of modes are involved?
By analyzing this data, the infrastructure can be adapted efficiently to make the crossing safer.

Accessibility
By combining different data sources (Floating Car Data, Telecom data and isochrones), we can generate a very accurate view of who goes where depending on time and day.

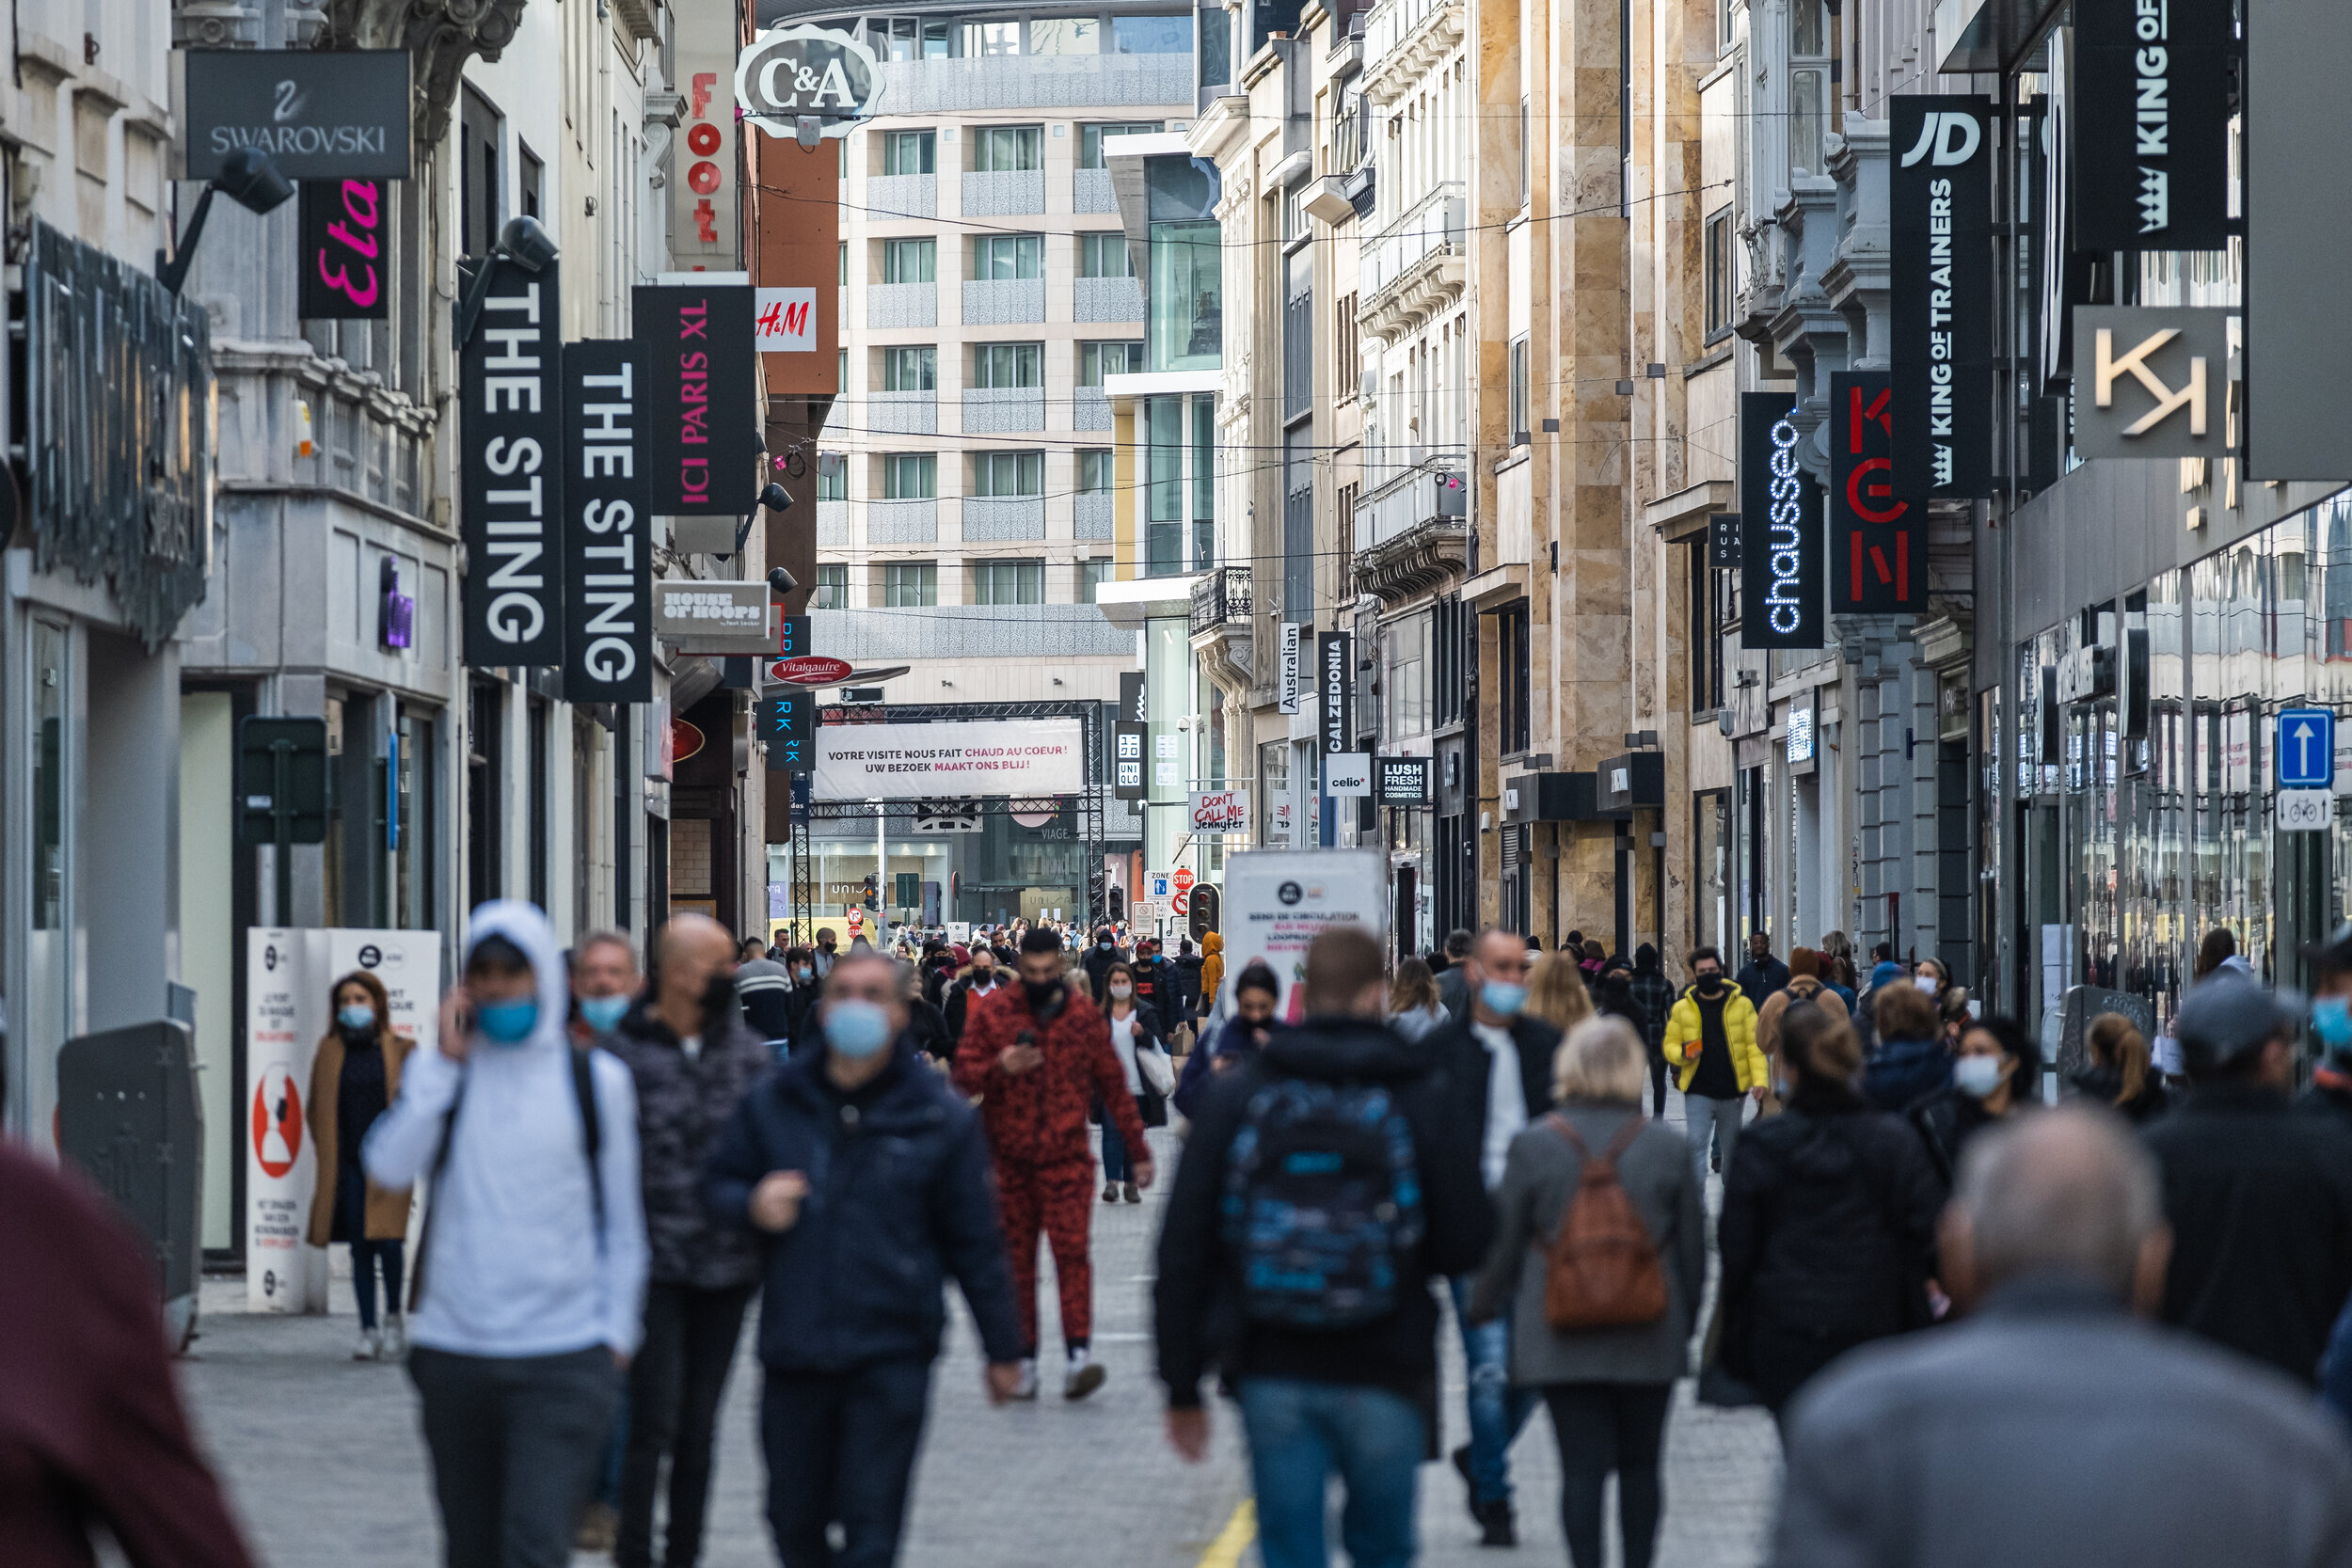
Increase the intensity in shopping streets
For Brucity we have used a combination of Telco data, Google Maps APIs and isochrones to place road signs in an area of 5 km² around shopping streets.
The purpose: to stimulate visitors to come by bike or on foot.
After the benchmark we follow up the effects of these signs using Telecom data.
Mobility and safety
Law enforcement can use this data to determine the dangerous areas. The result: a higher efficiency.
This can also serve as a basis to make a priority list for infrastructural improvements, together with the city council.

Take a look at the product sheet
Discover what the Geo Mobility has to offer for you in a convenient PDF.
They trust our data


Projects we’re proud of
“De Oosterweelverbinding” will eventually solve a lot of traffic issues in and around Antwerp. More than 100 km of road is constantly being monitored (using ODIQ) until completion of this large infrastructure project.
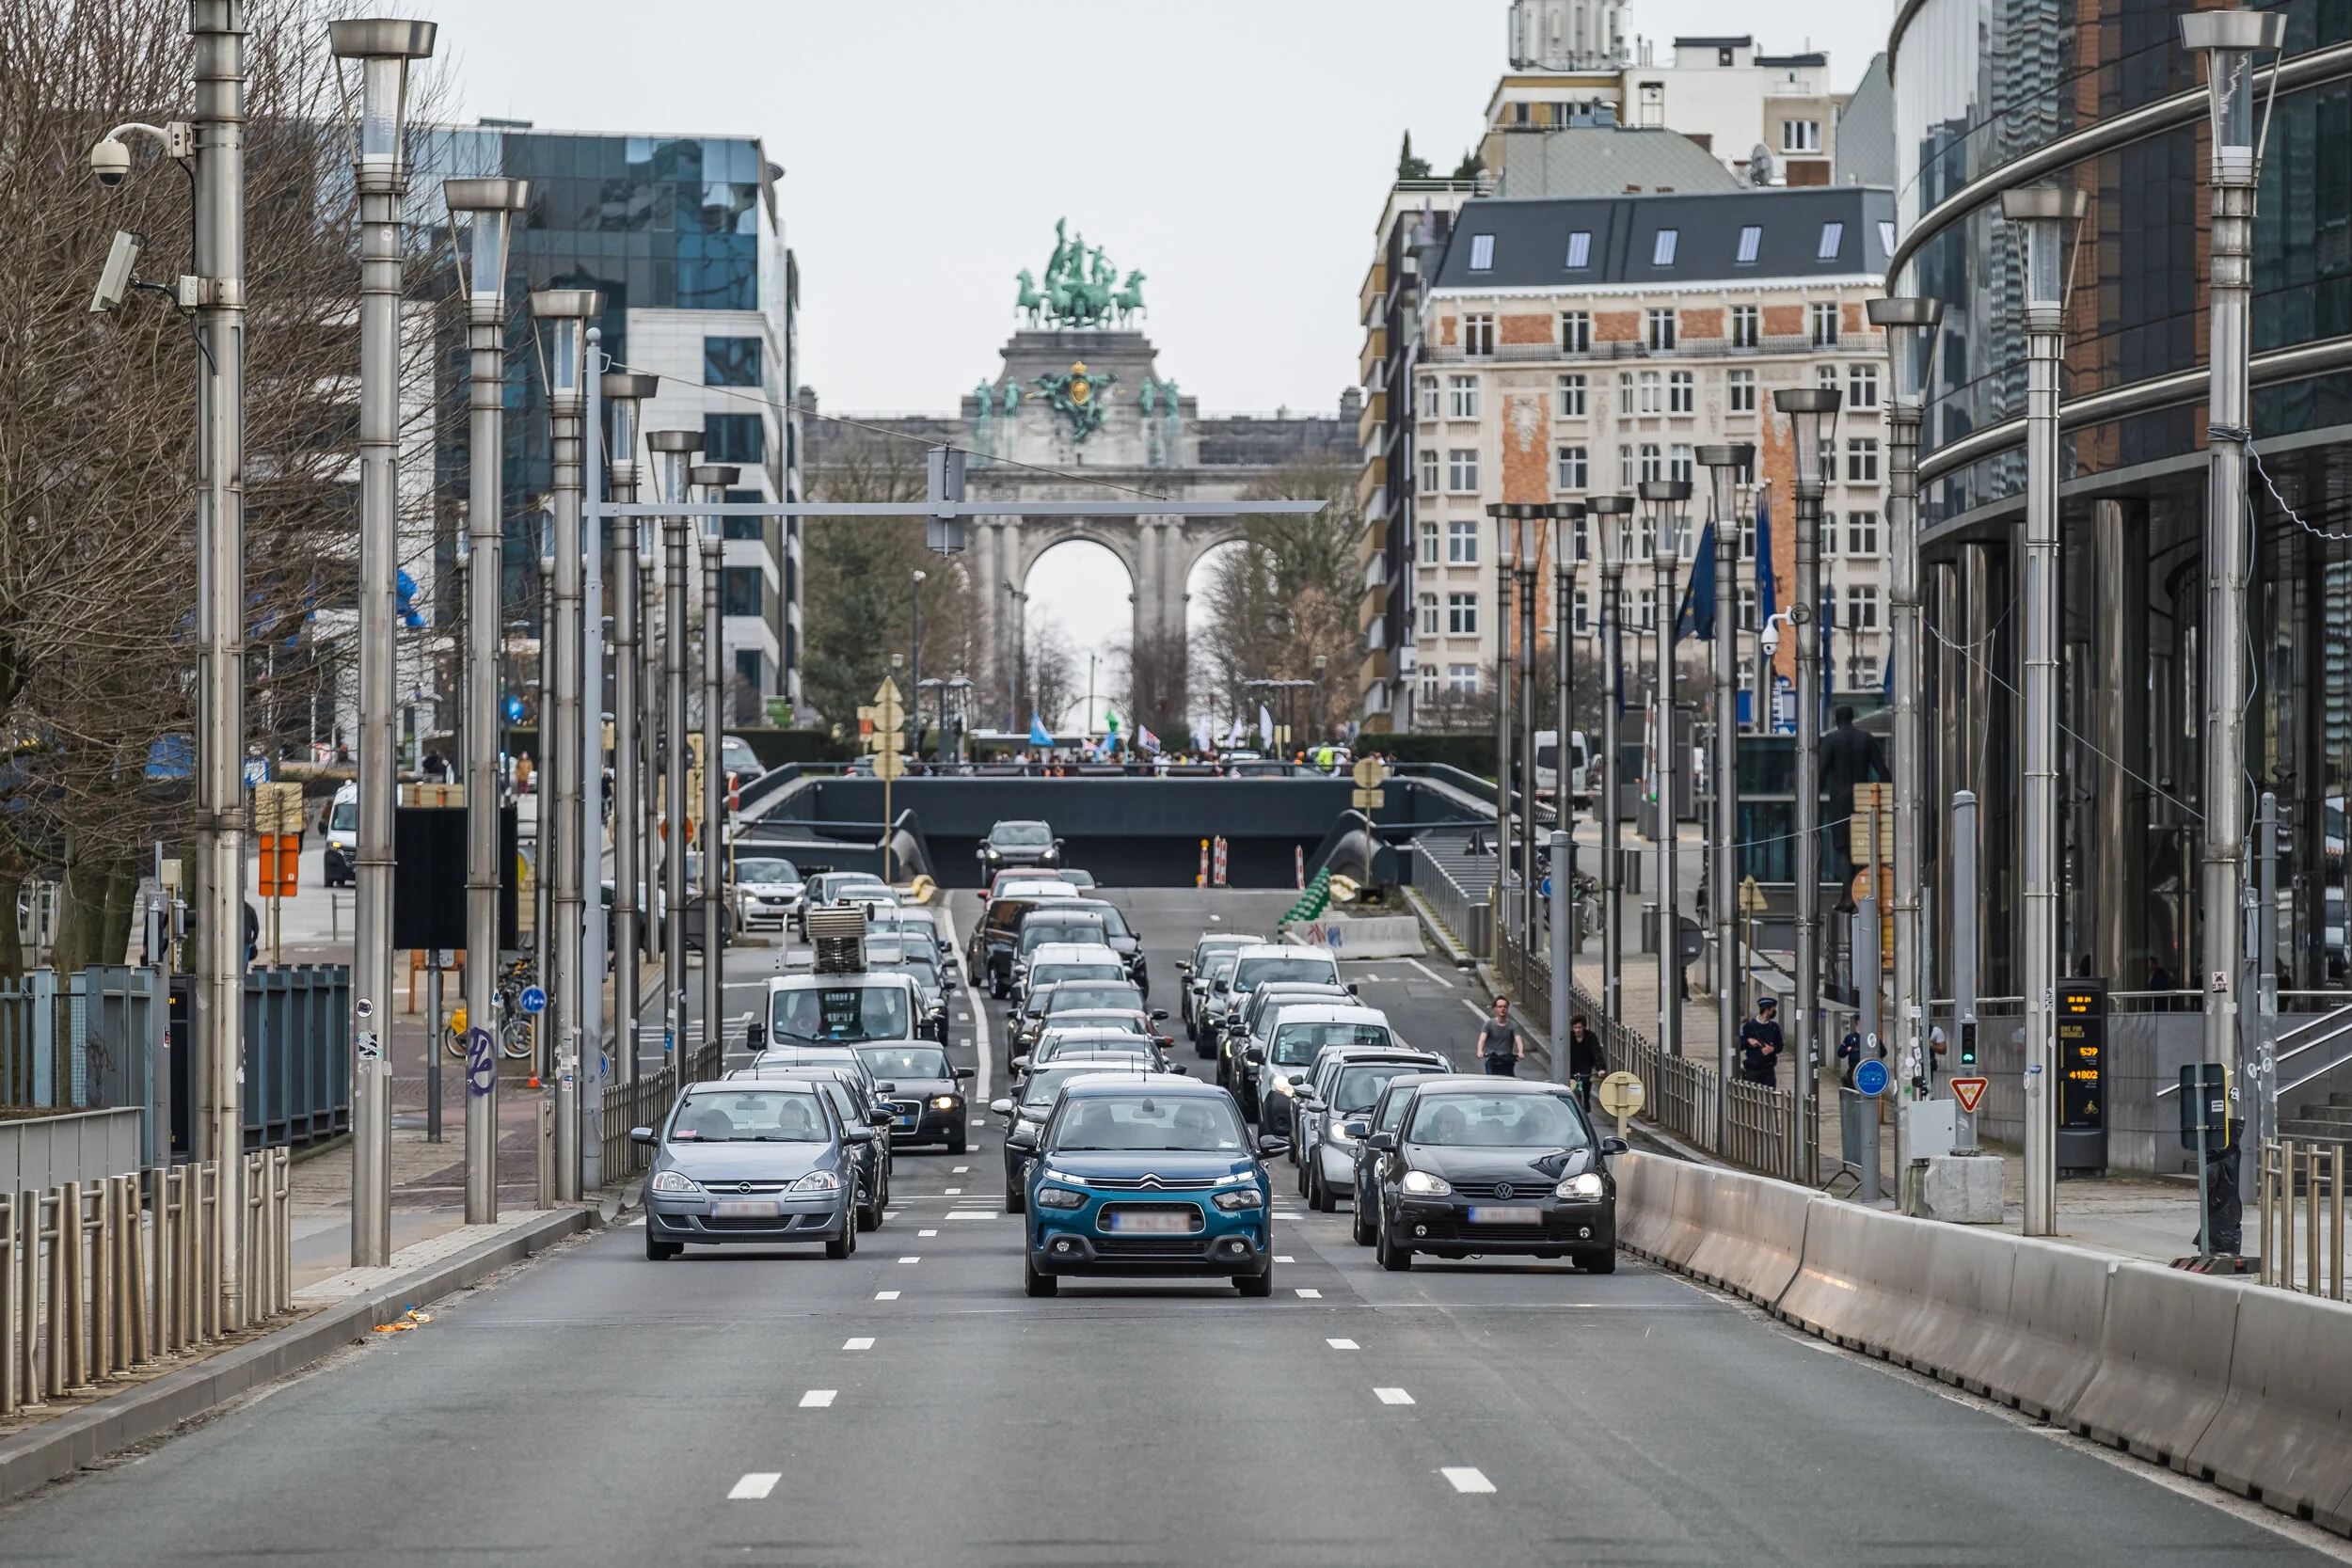
In 2020, both road infrastructure and intensity has changed in Brussels. By combining two Floating Car Data sources, road authorities have a historic and real-time, detailed view.
The town square will be car-free by 2023. To assess the impact, an origin-destination analysis was done, which we extrapolated based on parking data and a detailed CCTV analysis.